30 days of side-hustle agentic engineering: what shipped, the honest caveats, and the day-job comparison that surprised me.
1. Frame
I work on a large defense-industry software-engineering program at my day-job — mature codebase, production-rigor controls. After hours, I run an agentic-engineering lever solo on personal projects — coordinating an agent stack while it does the bulk of the implementation work (a prediction research system, an SDLC framework I'm building, a half-dozen others).
Same operator. Agentic engineering on both sides. Two very different rigor regimes.
I started actually counting what shipped on the side-hustle in April. Not to claim a multiplier — multipliers from solo projects to production engagements never survive scrutiny — but to establish a baseline for what one operator with a barely-built lever produces in 30 days, so I can watch the trajectory over the next 6 / 12 / 24 months as the scaffold compounds.
These are the numbers. Caveats included. The interesting part isn't the absolute count — it's the question the day-job comparison raises about where conventional engineering cost actually goes.
2. Vibe coding vs agentic engineering — what this post is about
A quick definition before the receipts, because the terms have blurred. And the photography parallel I keep reaching for actually has data — so let me bring receipts to the framing too, not just to the body.
Vibe coding is anyone logging into ChatGPT and prompting their way to working code. That's a good thing. Disposable cameras and smartphones lowered the barrier to entry for photography without erasing professional photographers — vibe coding is doing the same for software. Universal accessibility is a feature, not a threat.
The photography numbers, abbreviated:
- 1900: Kodak's Brownie launches at $1 (≈$39 in 2025 dollars). Pre-Brownie, photography was a wet-plate / darkroom / expert-only craft costing nearly a month's wages. The Brownie sold 10 million units in five years and made photography accessible to almost everyone. (JSTOR Daily, Wikipedia)
- 1900 → 2001: across 150 years of film-era photography, humanity captures roughly 1.5 trillion total photos. Film sales peak in 2001. (Keypoint Intelligence via Mylio)
- 2007: iPhone launches. Anyone with a phone has a camera.
- 2024: 1.9 trillion photos taken in one year. 94% via smartphone. 5.3 billion per day — about 61,400 every second. Single-year volume now exceeds the cumulative output of the entire 150-year film era. (PetaPixel, Phototrend)
- 2025 estimate: ~2.1 trillion. Growing 6–8% annually.
- Camera shipments fell 93% from 2010 to 2022 because nobody buys dedicated cameras anymore. (Aftershoot industry trends)
Volume up roughly five orders of magnitude in 125 years. Equipment market gutted. So the professional photography industry must have collapsed too, right?
It didn't.
- US photography industry revenue (2024): $15.8B, growing 5.8% CAGR over five years. (IBISWorld)
- Global photographic services: $30.4B in 2024, projected 7.6% CAGR through 2034. (Market.us)
- US BLS photographer employment (2024): 151,200 jobs, projected +2% growth to 2034. (BLS OOH)
- US wedding photographer average cost (2024): $2,900 — rising every year since 2016 except 2023. (The Knot)
- Commercial & industrial photography: fastest-growing segment at 7.1% CAGR. (Mordor Intelligence)
What collapsed was Kodak — the incumbent that sold the cameras and the film. (Quartr) Not the photographers.
What happened: smartphones absorbed the commodity segment — birthdays, vacations, pets, the snapshot category that the Brownie itself first democratized in 1900. Professional photographers shifted toward the segments where rigor and skill compound: weddings, commercial, editorial, architecture, events, portraits. The pros didn't get cheaper. They got more specialized — and prices rose. The amateur volume floor went up by orders of magnitude. The professional ceiling went up too. Both layers thrive. They aren't competing for the same job.
That's the playbook. Now apply it to software.
Agentic engineering is the big leagues. It's software engineering and a coordinated agent stack pulled together as one lever — producing professional, enterprise-grade software.
Vibe coding is software's smartphone moment: ChatGPT made program-creation universally accessible the way the iPhone made photo-taking universally accessible. The volume of code produced is going to follow the same arc — orders of magnitude up, dominated by non-specialists. CRUD apps, internal tools, scripts, hobby projects, "I just need a small thing for my cousin's bakery" — all vibe-coded now. That's the commodity layer. It's good for everyone, the same way smartphone snapshots are good for everyone.
Yes, sometimes the loop devolves into the "Claude plz fix" cat-meme until something compiles — same way some smartphone photos come out blurry. The commodity layer's failure-mode floor is low. That's the cost of universal accessibility, and it's a cost worth paying.
What changes for professional software engineering is the same thing that changed for professional photography: the commodity floor rises, and the work that compounds shifts higher. Production-rigor systems — regulated, enterprise, security-critical, operationally load-bearing, the systems where one bad ship costs real money or real harm — still need engineering discipline. Agents don't replace that discipline. They multiply the lever an engineer already had.
The difference between the little leagues and the big leagues isn't whether you use the tools. It's whether what you ship survives a customer's CFO, a security review, a regulator, or an on-call rotation. Engineering done faster without sacrificing quality. That's hard.
The receipts below are what one operator running an agentic-engineering stack — not vibe-coding-at-scale — produced in 30 days at solo-exploratory rigor. The frame matters because the comparable in §5 is meaningless if you read this as "chat-jippity barfed this out for me."
3. Scope shipped — 2026-04-01 → 2026-05-09 (39-day window; "30 days" in the title is the round-number headline)
Across 11 repos, side-hustle ~10–15 hrs/week. These are aggregate output — operator-directed (me, coordinating the agent stack), agent-implemented. The keystroke split is something I'll measure later; for now the artifact-count is the load-bearing number.
| Artifact | Count |
|---|---|
| Merged PRs | 147 across 11 repos |
| Commits (excl. merges) | 416 |
| Issues opened | 111 |
| Issues closed | 122 |
| Net LOC | +96,047 (+131K / −35K) |
| Knowledge-base entries created | 109 new entries (architecture, decision-tracking, research, reference) |
| Active days | 28 of 39 |
Lead repo (prediction research system) — 158 commits, 33 feat: commits, +62K net LOC.
Counted manually-verifiable artifacts only: merged PRs from gh pr list, commits from git log --no-merges, knowledge-base entries from git log --diff-filter=A. Numbers reproducible — the queries are in the appendix.
4. Effort — both estimates, internal-consistency check
This is where I have to be honest about a gap.
Self-reported side-hustle profile (dead-reckoned):
- ~10–15 hrs / week × 5.5 weeks ≈ 55–83 hours
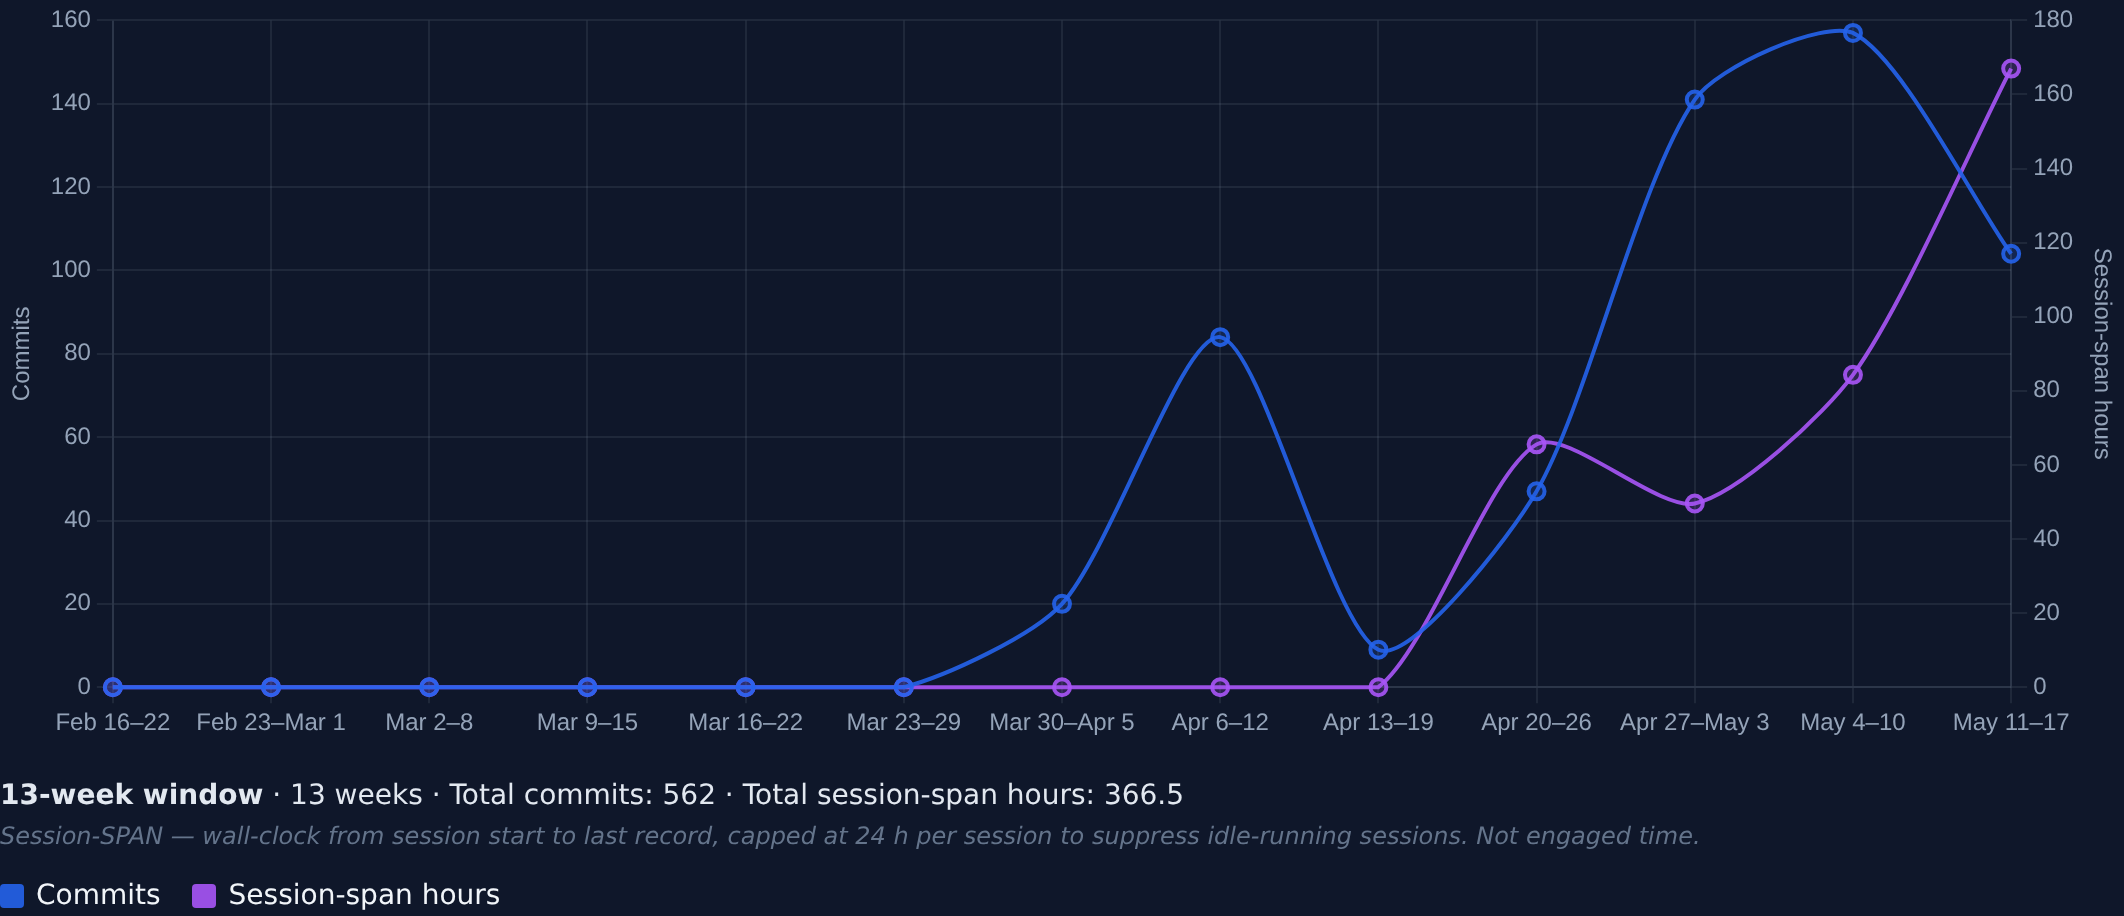
Session telemetry (sum of ~/.claude/projects/*/*.jsonl start→end durations, capped at 24h/session, CLI-only):
- 68 sessions × ~2.15 hrs avg (capped) ≈ 146 hours
The gap (~63–91 hours) is calibration signal worth naming:
- Session-span ≠ engaged-time. A terminal left open during dinner counts as "session time" by start→end span. The 24-hour cap helps but doesn't fix it.
- I run multiple terminals simultaneously (one for the lead repo, one for notes / knowledge base, one for tooling). They overlap; raw span double-counts.
- Some session time is background work the agent stack runs on its own — terminal kept alive while that finishes. That accumulates "session-span" without corresponding operator-engagement.
The honest read is that engaged operator-time is closer to the self-reported ~55–83 hours, with the additional ~63–91 hours of session-span being a mix of overlap, idle, and agent-runtime. The v0 of the dashboard (Cursed_Personal_Stats) hasn't yet split those out — that's a v0.5 ask. The gap itself is data.
5. The day-job comparison — the part that surprised me
I had a chance to look at a comparable metric on the day-job program this week. An agentic AI reviewer analyzing our largest component flagged this: roughly 120 engineers × 3 months on the largest component → ~120 merged-changes at production-defense rigor. That works out to roughly 0.33 merged-changes / engineer-month.
Same window, the side-hustle lead repo alone: 99 PRs in 14 days = ~7 PRs / day running at solo-exploratory rigor. Solo rate normalized to engineer-month-equivalent: ~210 PRs / month.
Same operator. Two very different rigor regimes.
Some of you are going to read that and want a multiplier number. I'm refusing to give one. Here's why:
- Allocation isn't 1:1 either way. Engineers on a large defense-industry program aren't 100% allocated to one component (multi-program staffing, security overhead, meetings, certifications, ticketed-coordination). Side-hustle "engineer-month" is also notional — I don't work full-time on the side-hustle. So the implied ratio in the raw numbers above overstates the regime gap; the real per-engaged-hour comparison would be much closer (and is the more honest one to make once the dashboard splits engagement from session-span).
- Production-rigor in regulated industries (controls, certifications, threat-modeling, multi-reviewer signoff, regulatory documentation) is intentionally expensive. The throughput penalty isn't waste — it's what keeps the system shippable in environments where bugs cost lives.
- Solo-exploratory rigor (tracked internally, but without external compliance gates, client signoffs, or multi-reviewer requirements) is intentionally cheap. The throughput advantage isn't intrinsic operator velocity — it's the absence of overhead the production context needs.
The interesting insight isn't "agentic engineers are N times faster." The interesting insight is: a non-trivial fraction of conventional regulated-industry engineering cost is process overhead, not production work — and that fraction is now visible by the same operator running both regimes. That's a question worth asking — not a multiplier worth advertising.
If you want to know what an agentic operator can do without the production-rigor wrapper, the side-hustle numbers above are one data point. If you want to know what they can do inside a production-rigor wrapper, the regulated-industry-program comparable above is the other. Both are real. The space between them is the interesting question.
6. Caveats (non-negotiable)
What this post does not claim:
- LOC is not productivity. Steve McConnell, Code Complete 2nd ed., Ch. 28: "Measuring programming progress by lines of code is like measuring aircraft-building progress by weight." DeMarco & Lister, Peopleware: LOC metrics incentivize verbose code. Read LOC here as a directional signal; productivity claims would need different evidence.
- No industry-baseline multiplier. "X times faster than the average developer" requires a controlled baseline that does not exist for solo-vs-team work. Survey data (StackOverflow, GitHub Octoverse, State of DevOps / DORA) measures org-level activity — individual-velocity baselines don't live there. The day-job comparison in §5 is intentionally a regime-overhead question; the N-times-faster framing is out of scope.
- The day-job comparison is generic-industry, not a controlled experiment. §5 is anecdote-from-experience: I work on a large defense-industry software-engineering program; the load-bearing claim is the orders-of-magnitude shape, while the precise figures are noise. Different programs, different teams, different scoping conventions for "merged-change" — anyone in regulated-industry engineering will know the throughput shape varies by an order of magnitude across programs. Read the 0.33-vs-210 numbers above as my-program vs my-side-hustle. Generalizing to a regulated-vs-exploratory benchmark would require many more programs.
- Self-trajectory is the most reliable measure here. What one operator (me) produced in one window (April–May 2026) on side-hustle hours with one agent stack. Generalizing requires more operators, more windows, more stacks. The honest comparable is me-30-days-ago vs. me-now vs. me-6-months-from-now — that's the trajectory the cornerstone is the t=0 of.
- Quality and strategic-correctness are not measured here. High-velocity-wrong-direction is worse than low-velocity-right-direction. These are activity counts; value claims would need different evidence. Goodhart's law is the standing watch-out.
- The 14-day lead-repo baseline (99 PRs) was 107 in an earlier internal note. The note was written 2026-05-08; the re-query 2026-05-09 returned 99 / 14d (and 110 / 15d). Original was a mid-day snapshot. Rate (~7 PRs/day) is the load-bearing claim; absolute count moves with cutoff time.
7. Compounding thesis + the stump-of-a-lever
Here's the part that turns a receipts post into something forward-looking.
These receipts were produced with the stump of a lever — about one month of cobbling-together. As of writing:
- Personal-stats dashboard (Cursed_Personal_Stats) v0 is built and running as of this writing. It's the surface that produced the numbers above.
- Cost dashboard — architecture spike done, not yet operational.
- Rollup dashboard, GTM tooling, public-receipts hub — none of these exist yet.
The numbers in §3 are the floor of what this lever produces, not the ceiling. They were generated before most of the scaffold exists. The asymmetric-bet question this post is the first deposit on:
What does this look like at 6 / 12 / 24 months as the lever scaffold compounds?
I don't know the answer. The receipts above are early-window evidence that the rate is non-trivial; the rest is a soak. Same shape as a forecasting evaluation — the first 30 outcomes don't tell you the operator's edge, they tell you whether continued sample collection is worth the cost. These 39 days suggest it is.
A few specific overlays I want on the dashboard's v0.5 — and that I'm calling out here so I can hold myself to them publicly:
- Velocity acceleration curve over time, side-by-side with token burn rate from the same period. The story is in the relationship: when does an output spike correspond to an input-cost spike, when does it not?
- Milestone annotations on the time series — the lever's own development is the most interesting overlay, because each piece of scaffold that ships should be visible as a regime change in the receipts.
- Per-project lane separation so I can see which projects are accelerating vs. decelerating, and whether the lever produces more of one or the other as it matures.
I'll publish a follow-up when the v0.5 dashboard ships those overlays. The point of the cornerstone is to start the clock — these are the numbers at t=0 of the lever, with the scaffold barely built. Future posts measure the rate-of-change.
Where this is heading: helping engineering orgs establish their own version of this lever. Same agentic-engineering substrate, different problem domains — your version would look different because your problem isn't mine. The dashboard referenced above is one application of it.
And honestly: for all I know, I'M the tool here. Some days the skill gap between what agents can do and what I can articulate about them feels like it's growing. The lever-builder is also figuring out what the lever IS.
If you're working on agentic-engineering tooling and want to compare notes on what your dashboard shows — DM open. If you're a buyer of agentic capability and want to talk about what continuous self-trajectory tracking implies for your own engineering org — also open.
Hey look what my agents did. Here's proof. Want your agents to do the same for your team? Let's talk.
Appendix: How to reproduce these numbers
# Per-repo PR counts since 2026-04-01 (run from each repo dir)
gh pr list --state merged --search "merged:>=2026-04-01" --limit 500 --json number | jq length

# Per-repo commit counts (excl. merges)
git log --since=2026-04-01 --no-merges --shortstat | awk '/^commit/{n++}END{print n}'

# Knowledge-base entry production (from notes-repo root)
git log --since=2026-04-01 --diff-filter=A --name-only --pretty=format: -- '*.md' | sort -u | wc -l
Personal-stats dashboard source: Cursed_Personal_Stats